Arabica vs Robusta exports 2026: Robusta took the decade's growth.
Arabica vs Robusta exports 2026: Robusta supplied 97 percent of a decade's growth in world output, and Arabica's export share fell below 60 percent. USDA, ICO.

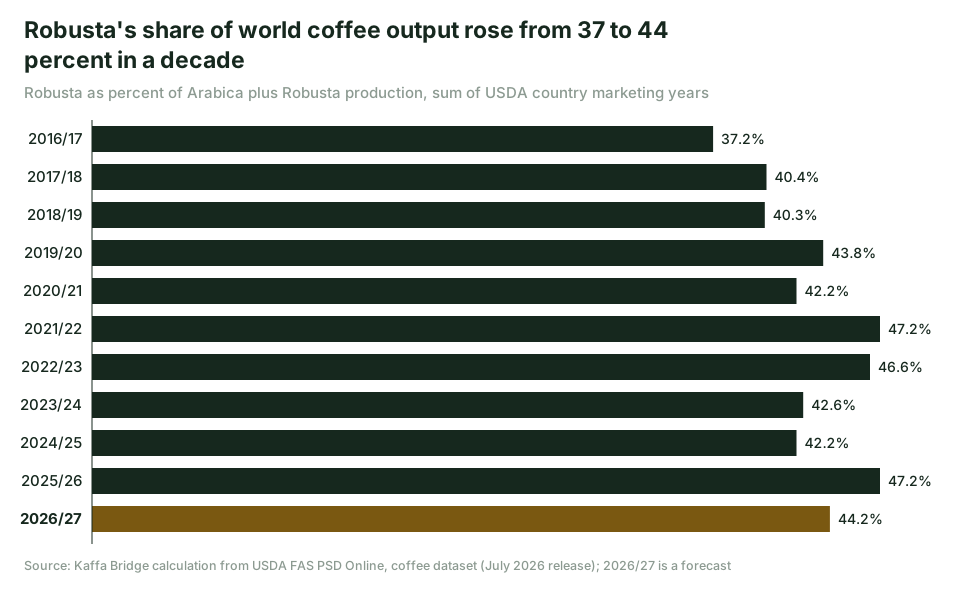
Almost all the growth in world coffee output over the last decade has been Robusta. Averaging three years at each end to smooth Brazil's two year cycle, USDA data show world production up 16.2 million bags. Robusta supplied 15.8 million of that, 97 percent. Arabica rose by 0.4 percent. The export data now show the same thing: the ICO says Arabica's share of green bean exports has fallen below 60 percent for the first time on its record for the first eleven months of a coffee year.
Ten years in two rows
| Average of three USDA years | Arabica | Robusta | Robusta share |
|---|---|---|---|
| 2016/17 to 2018/19 | 100,429 | 65,154 | 39.3 percent |
| 2024/25 to 2026/27 | 100,861 | 80,910 | 44.5 percent |
| Change | +432 (+0.4 percent) | +15,756 (+24.2 percent) | +5.2 points |
Thousand 60 kg bags, our sums of every country in the USDA PSD coffee dataset, July 2026 release. 2026/27 is a forecast.
The country breakdown
Brazil, not Vietnam. On the same three year averages Brazil's Robusta rose 10.2 million bags, from 13.3 to 23.5 million. Uganda added 2.3 million and Vietnam 2.2 million. On the Arabica side the flat total hides a swap. Brazil's Arabica average fell 1.6 million bags, Honduras 1.8 million and Colombia 0.5 million. Ethiopia's rose 4.6 million, from 7.1 to 11.7 million bags, the largest Arabica gain of any country. Without Ethiopia, the decade's Arabica total would have fallen.
Pick a different start year
Pick 2021/22 to 2026/27 and Robusta's USDA share falls 3.0 points, from 47.2 to 44.2 percent. That start year was the low point for Brazil's Arabica, which the USDA says lost 13.3 million bags to drought and heat. Endpoints on a biennial crop can show almost any trend.
The two agencies also disagree on the level. For 2025/26 the ICO estimates Robusta at 79.2 million bags, 43.1 percent of output. The USDA sum gives 84.4 million, 47.2 percent. They count different years: the ICO uses an October coffee year, the USDA each country's own marketing year. On matched years both show Robusta gaining from 2020/21 to 2025/26: 2.2 points on the ICO table, 5.0 points on ours. We use the USDA sums for the decade because the ICO report's table starts only in 2020/21, and we trust the direction, not either level.
The export side, ICO
| Period | Arabica | Robusta | Robusta share |
|---|---|---|---|
| 12 months to August 2025 | 85.97 | 54.48 | 38.8 percent |
| 12 months to August 2026 | 81.39 | 61.05 | 42.9 percent |
Million bags, from the ICO's September 2026 summary on its homepage; the share is our arithmetic. For green beans alone, Arabica's share of October to August exports fell to 59.6 percent from 63.5 percent. The ICO says the larger Robusta crop, relative prices and changing tastes may help explain the shift, and that it will examine this further. In September 2026 its Robusta indicator averaged 167.49 US cents per lb against 290.19 for Brazilian Naturals.
A species share says nothing about grade or quality, and summing country marketing years into a world total blends harvests that start in different months.
Using the split in a blend
- Recompute the Robusta share when the USDA's next world update lands. A 2026/27 figure above 44.2 percent means Robusta is gaining even in a big Brazilian Arabica year.
- Read the ICO's green bean Arabica share each month against 59.6 percent.
- For blends, price the two legs from the ICO group indicators, not from the composite.
- For Arabica, ask which origin is adding volume. On USDA numbers Ethiopia added the most over ten years.
If the Arabica leg of a blend is coming from Ethiopia, Kaffa Bridge can source it as the buyer's agent. The minimum is one full container load, priced on enquiry FOB Djibouti or CFR your port.